01A role that didn't exist yet
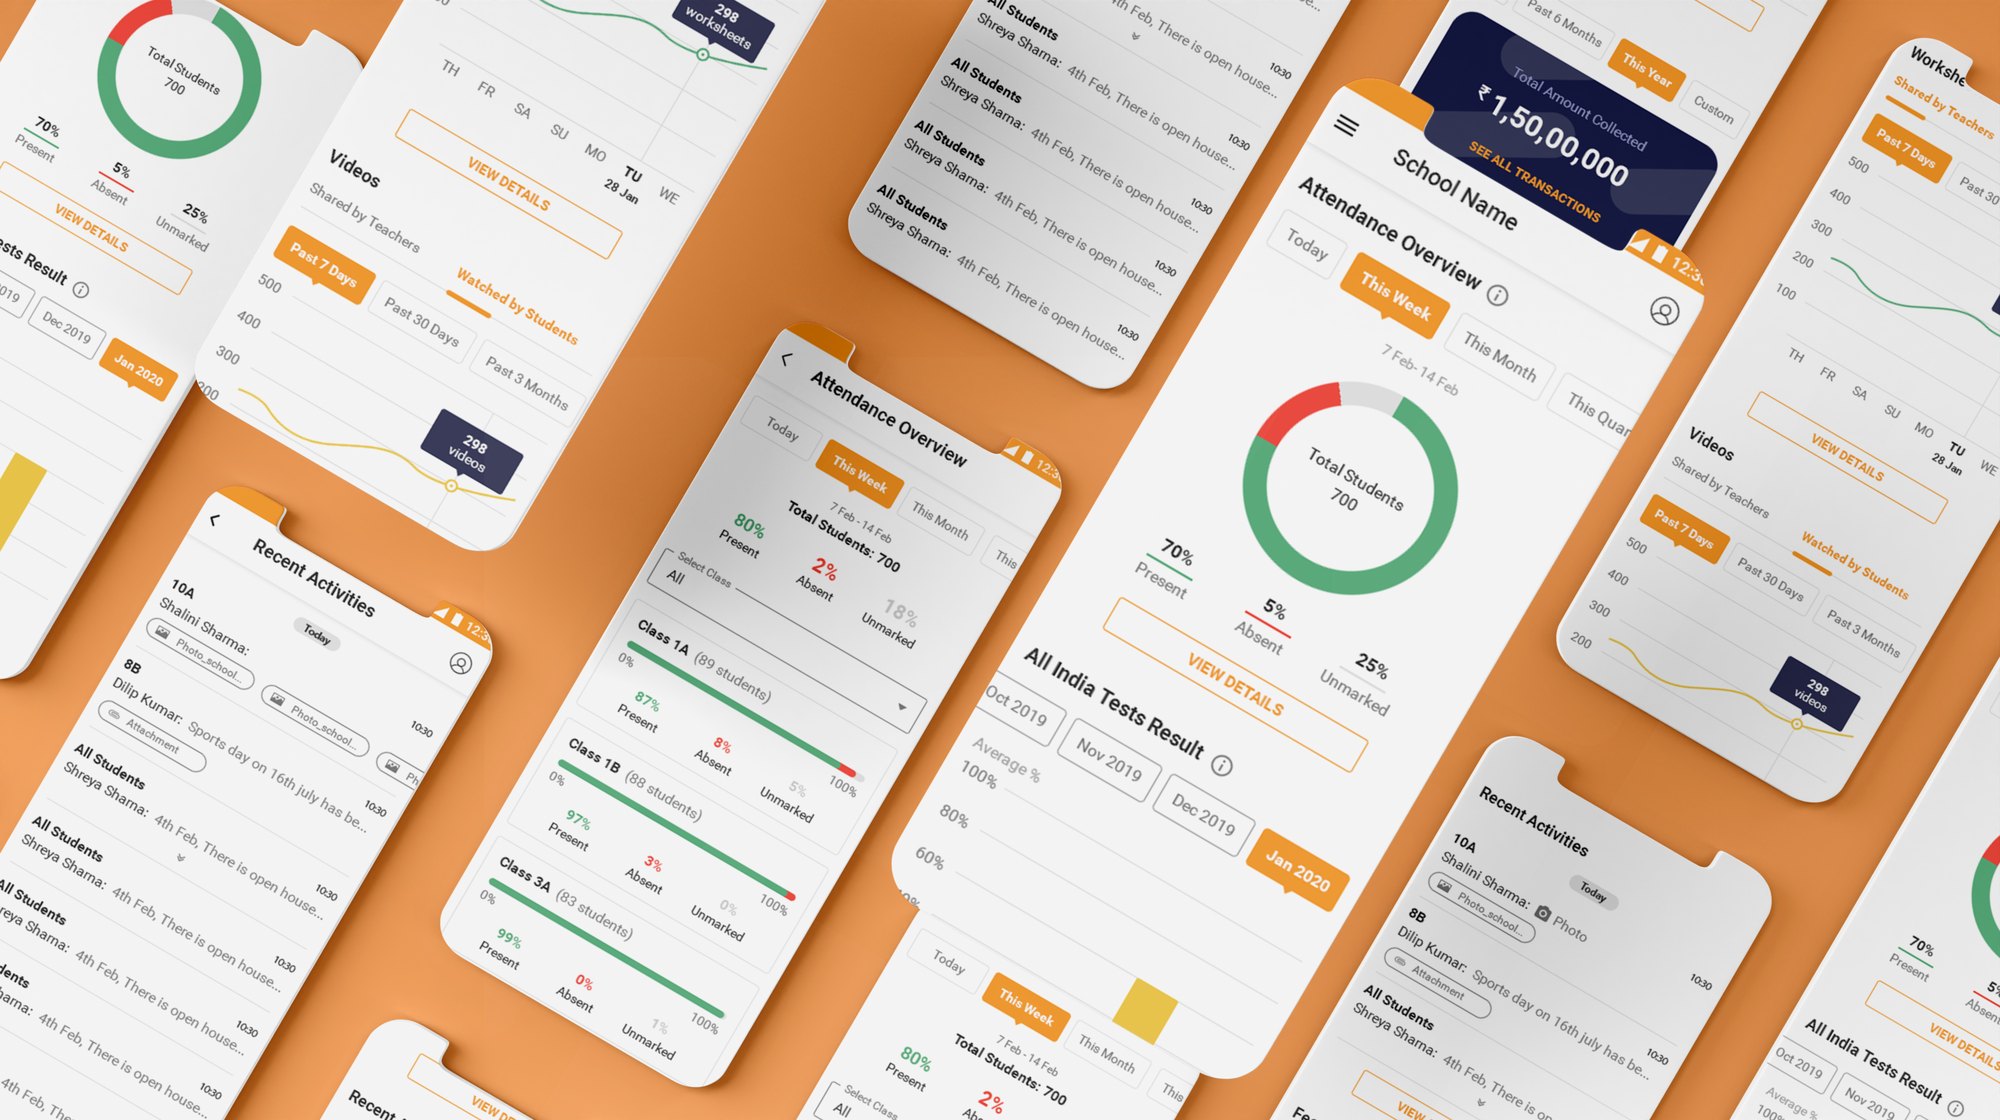
Teno already served four roles — Admin, Teacher, Parent and Student. The principal was the one person missing, and the one with the widest view of the school: attendance, academics, staff and day-to-day operations all sit on their desk. To stay on top of it, a principal had to piece the picture together from separate reports and screens.
The brief was to design that missing fifth role as a single Principal Dashboard — a command centre where every school activity is visible and monitorable in one place, on any given day.
02The objective
A principal carries numerous responsibilities toward school management and has to stay aware of everything happening across the school, every day. Because this was a brand-new role in the product, there was no existing pattern to lean on — the dashboard had to be defined from the ground up, starting from what a principal actually needs to decide and see.
The question I kept returning to: what does a principal need to know the moment they open the app — and what can wait?
03Research — who, what and why
I started with strategy, identifying the primary and secondary audiences. Since the principal was a new role, the work began from scratch: I interviewed target users and drew out the initial insights. From those interviews I built an empathy map to guide how the role should be shaped — what principals say, think, do and feel about staying on top of their school.
04Feature ideation
With the interviews synthesised, I ran ideation to turn those needs into candidate features for the dashboard — mapping what a principal would want to monitor, and how often, before committing to any layout.
05Who we were designing for
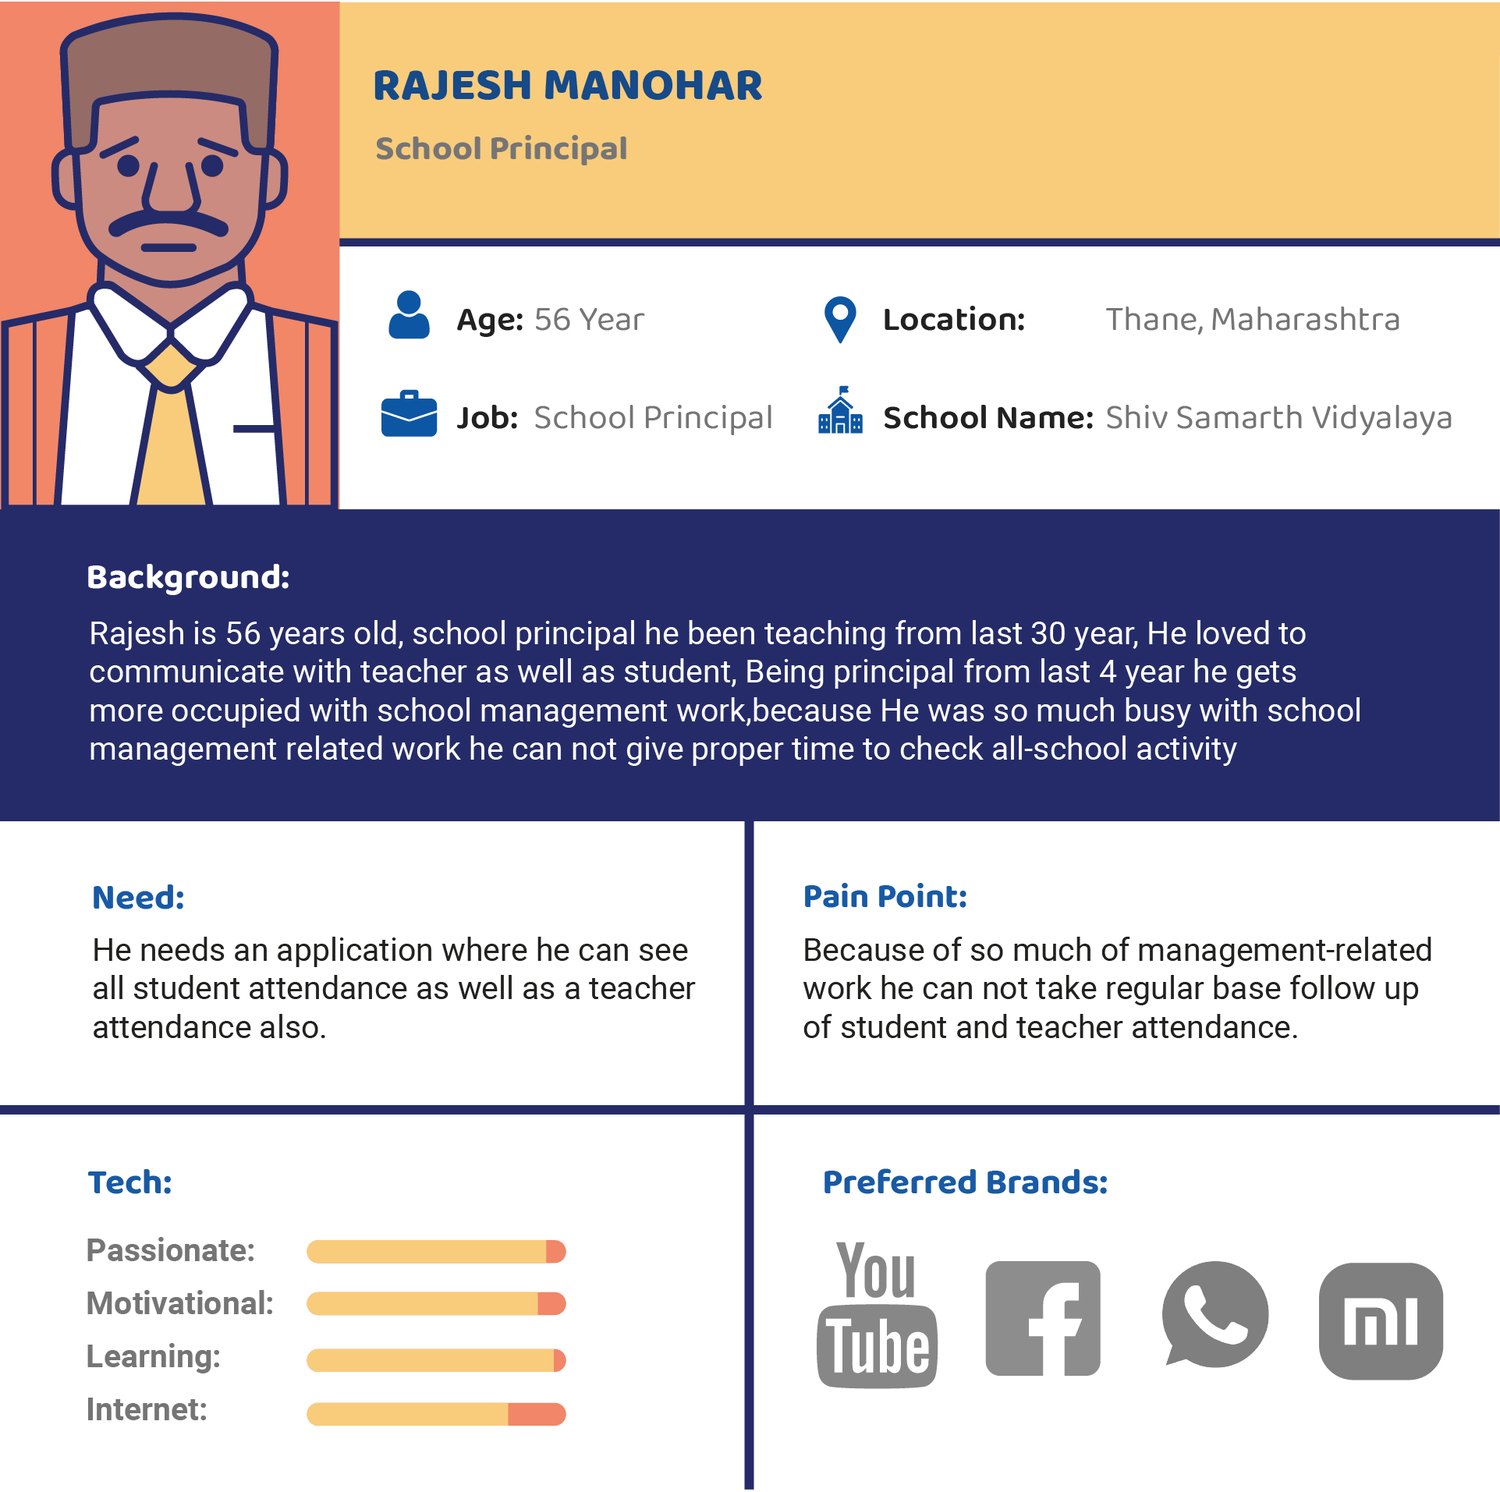
From the interviews and empathy mapping, one persona anchored the work: Rajesh Manohar.
Rajesh has been a principal for four years. He is fully occupied with school-management work and can't find the time to check daily school attendance. What he wants is simple: one place where he can see all the school's attendance, at his own convenience.
06Storyboard
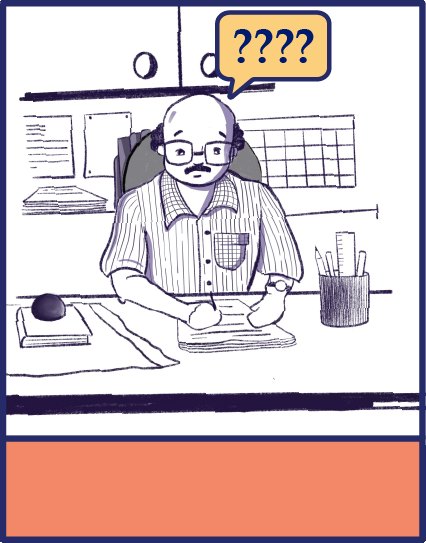
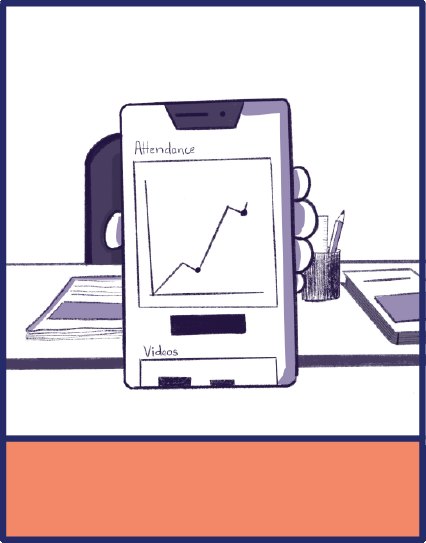
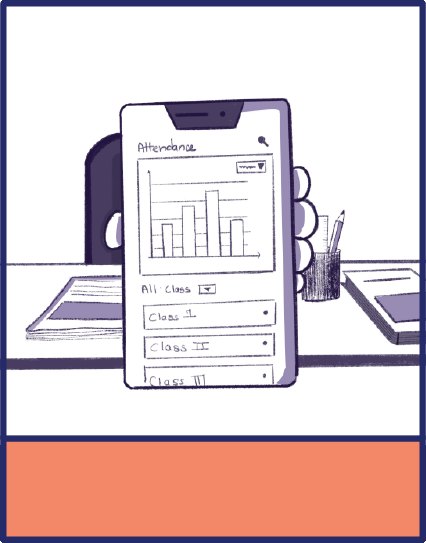
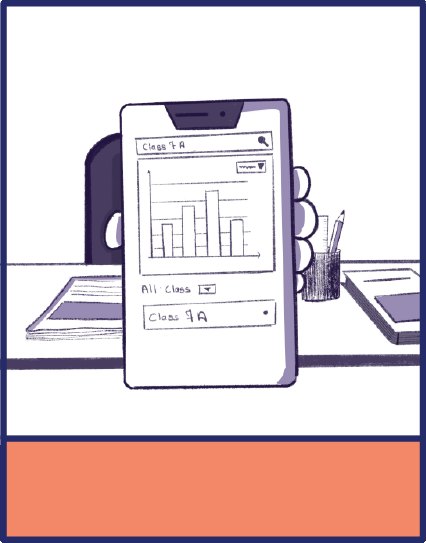
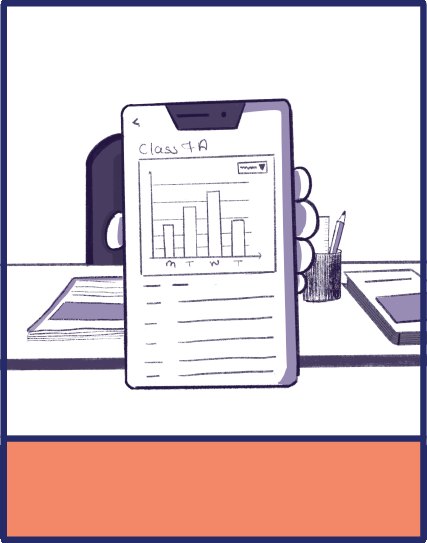
Everything starts with a story. Walking through the persona's scenarios turned an abstract need into a concrete flow, and showed exactly what information the dashboard had to surface. Rajesh's core story: he wants to check Class 7A's student attendance.
- He wants to check Class 7A attendance.
- He opens the Teno app.
- He goes to the attendance section.
- He selects Class 7A.
- He sees the attendance overview of all its students.
 1
 2
 3
 4
 5
07Task flow
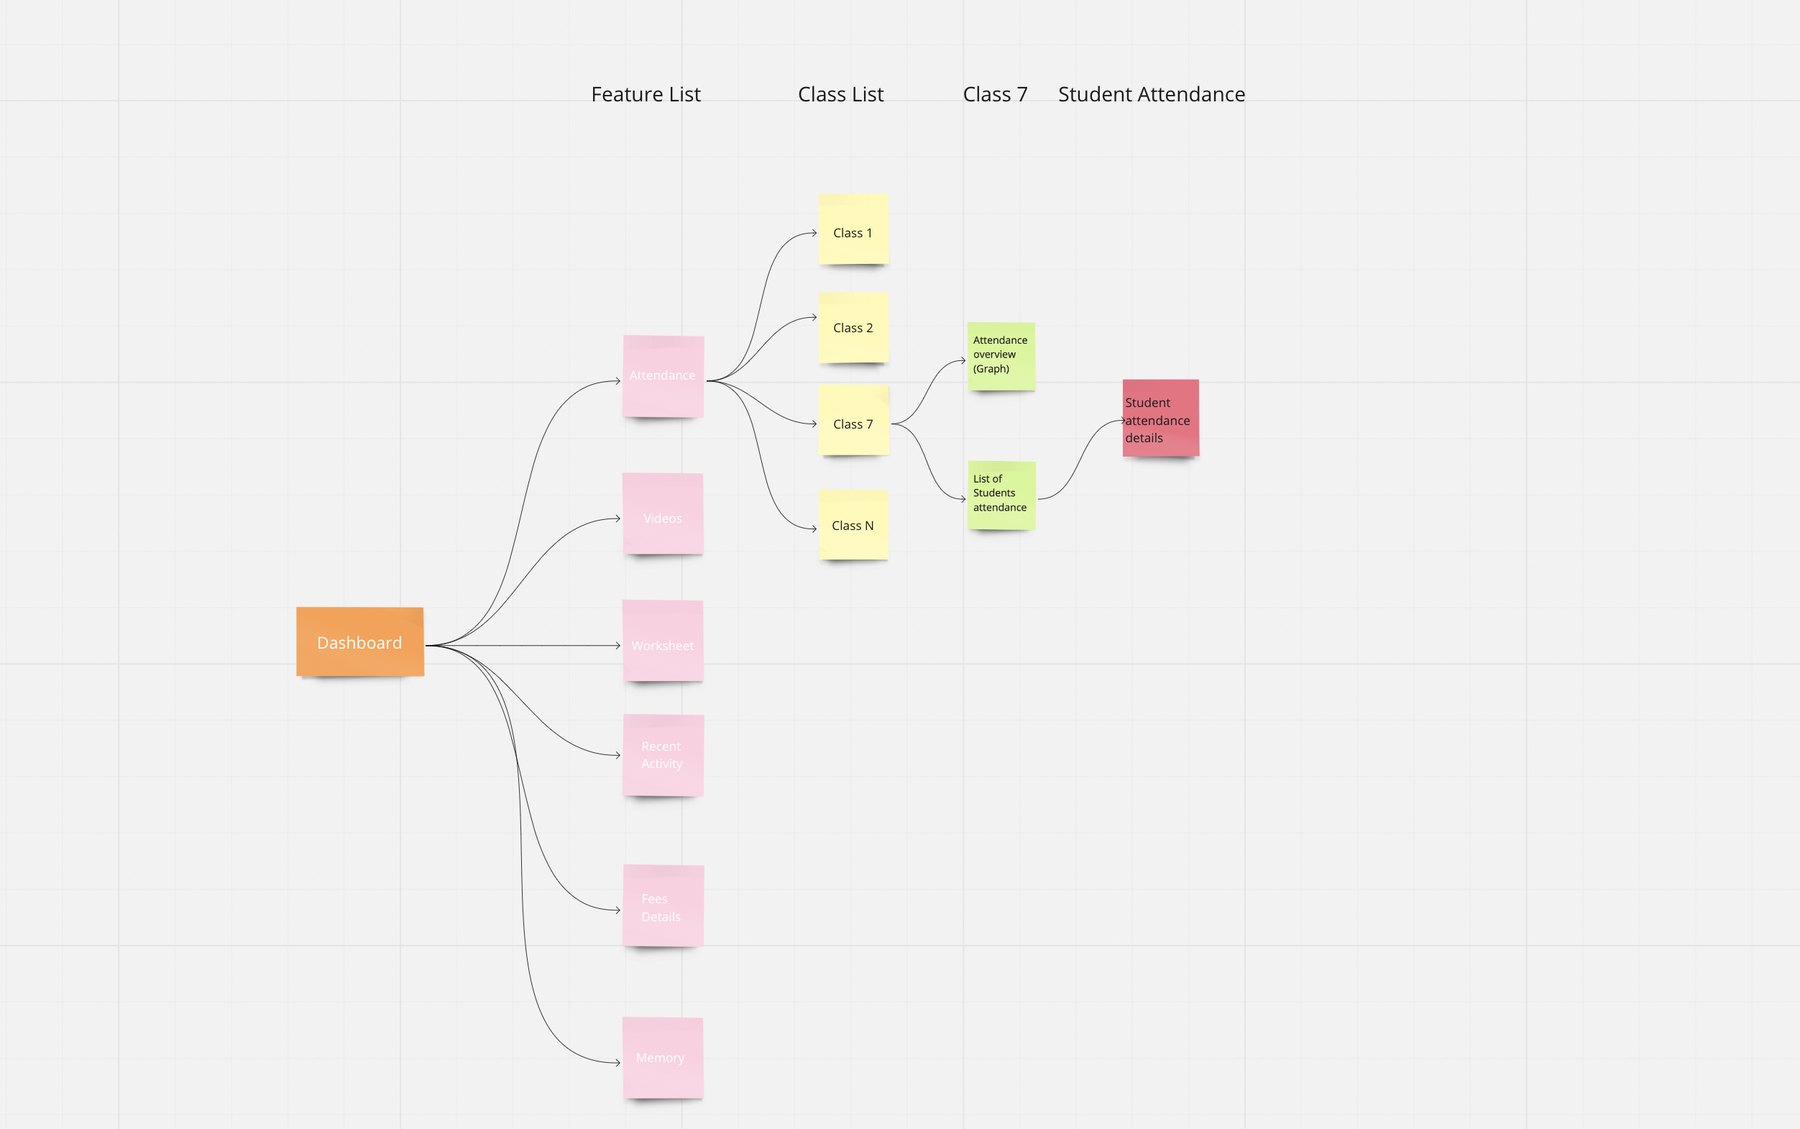
A task analysis let me walk the flow and pin down the key screens needed for a principal to check attendance. Three questions shaped the structure:
- How do they see the average attendance of the whole school?
- How do they see class-by-class attendance?
- How do they see a particular class's day-by-day attendance?
Answering these defined what had to be on the screen, and became the backbone of the wireframes.
08From sketches to high fidelity
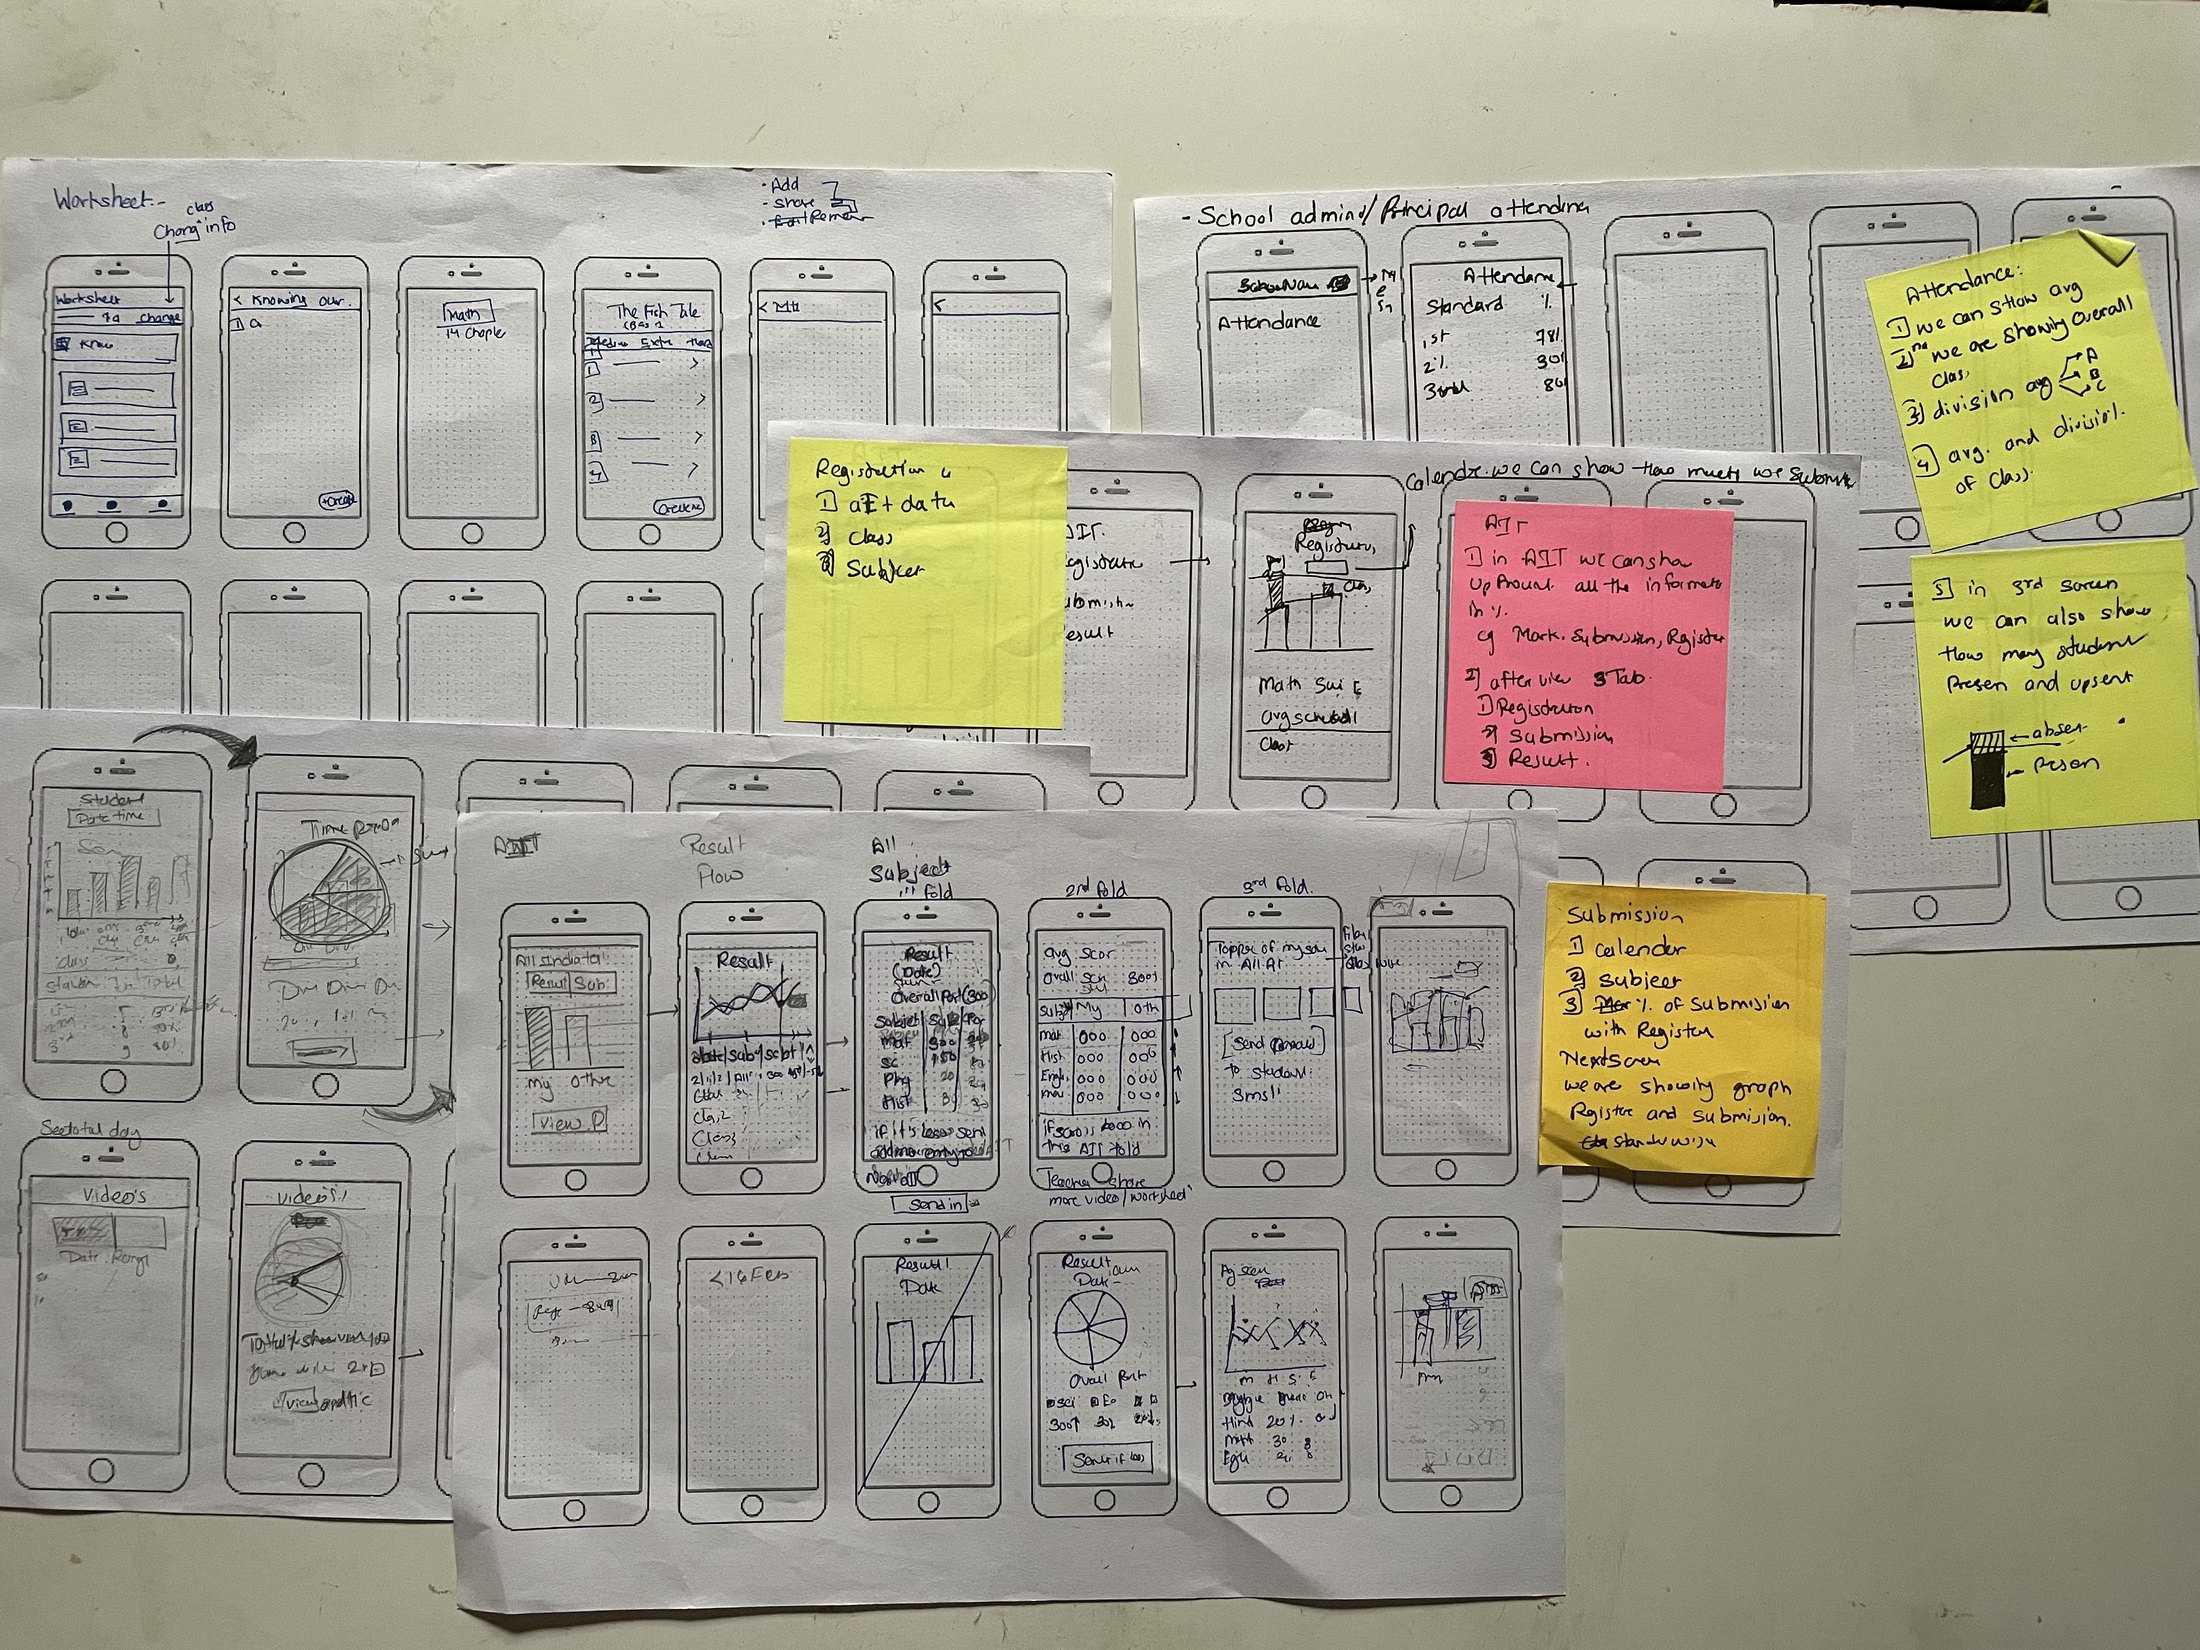
With research, persona, storyboard and task flow in hand, I moved to low-fidelity sketches — kept loose and flowing, deliberately light on detail, so I could think about where content falls on the page and iterate quickly.
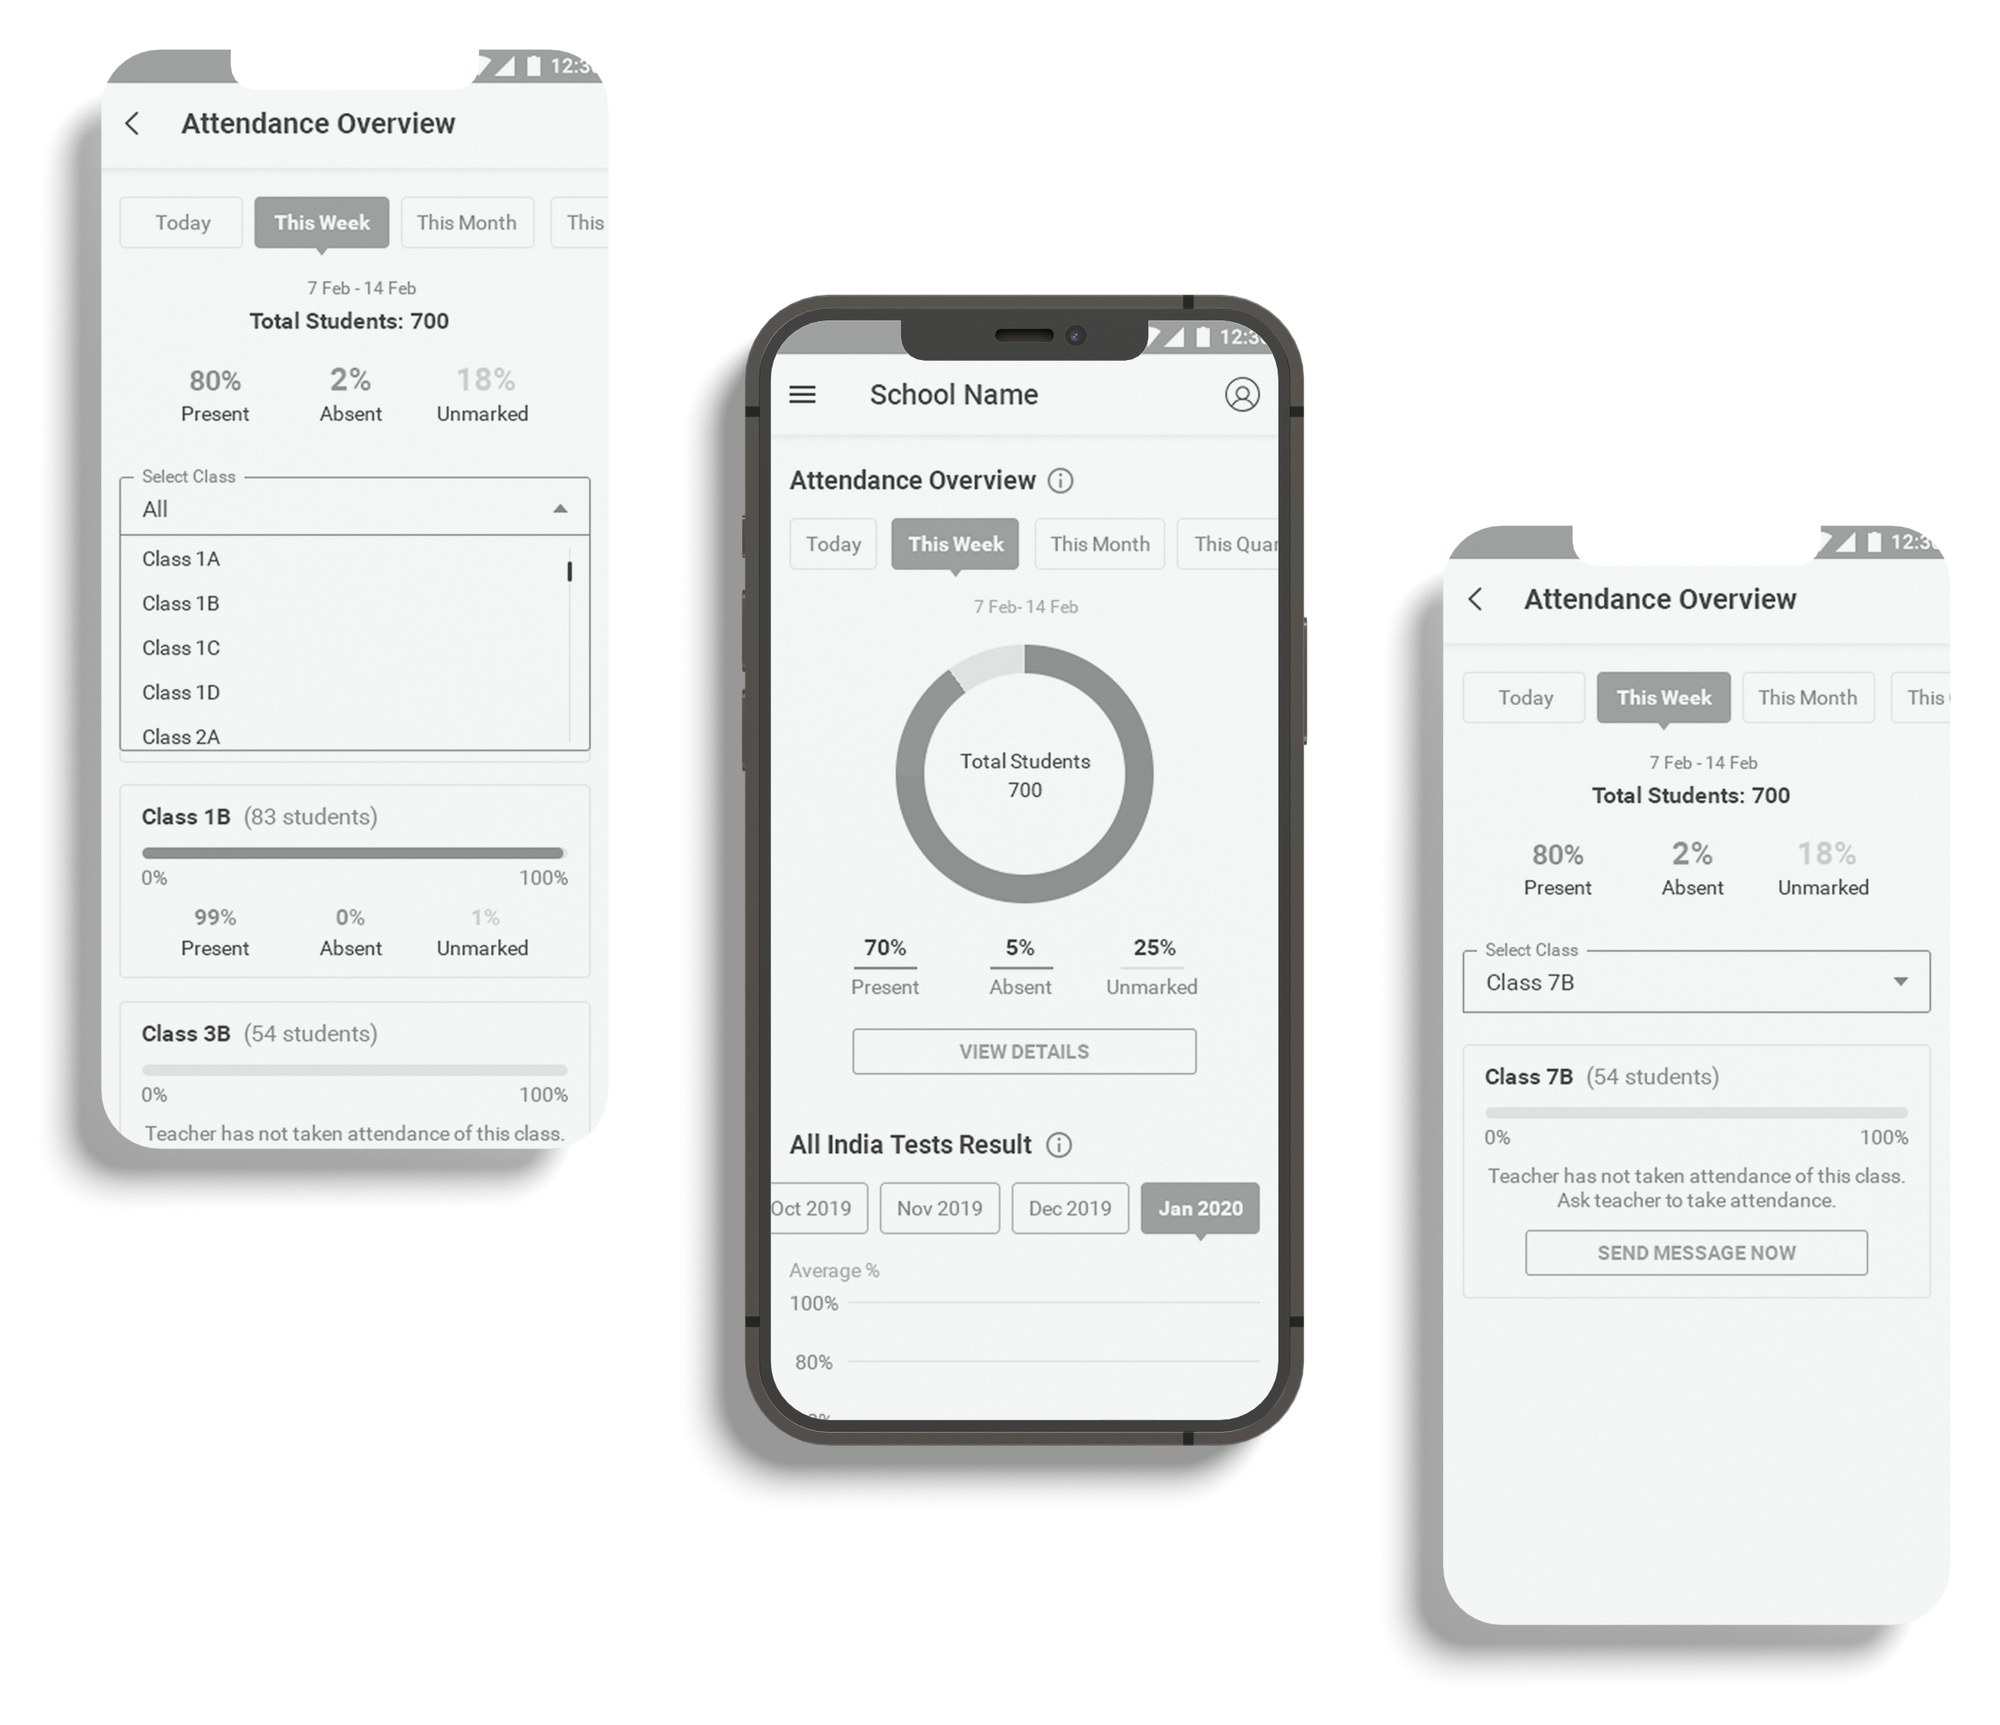
After reviewing the sketches with the product team and a couple of iterations, I refined them into a high-fidelity wireframe, locking the layout and element placement before committing to visual detail — so the structure could still change cheaply if it needed to.
09Prototype & usability testing
I built a high-fidelity prototype in Marvel, set up for usability testing around the core task: checking Class 7A attendance. I defined what to test and why, then ran it with 5 participants.
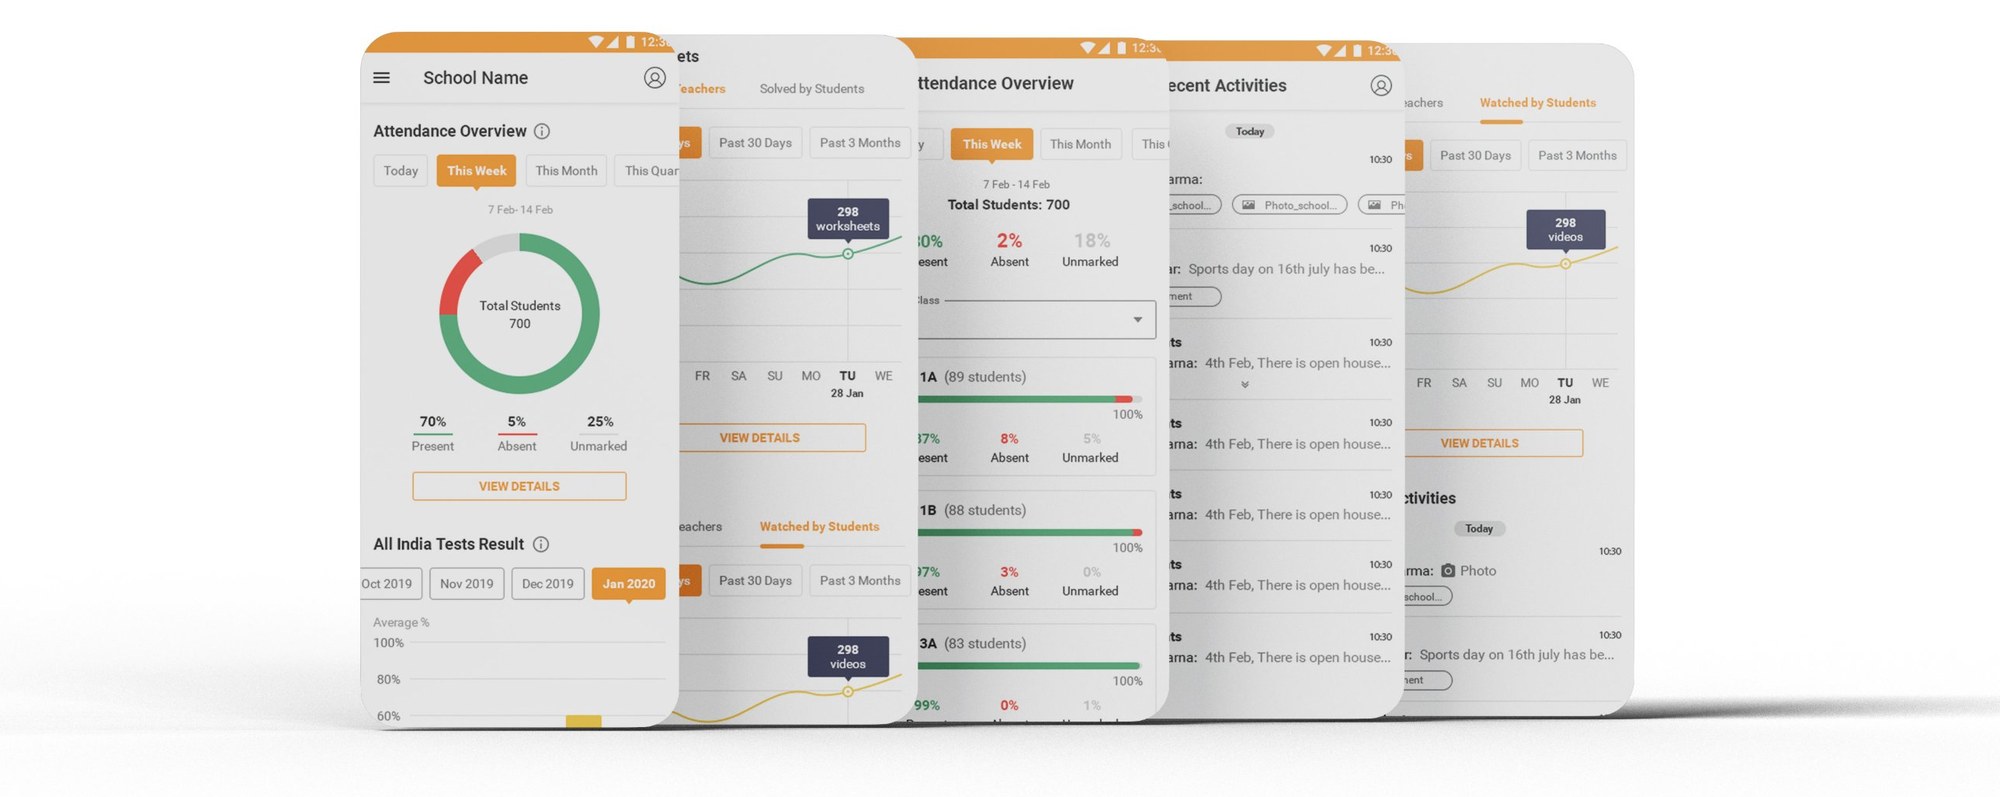
What the test set out to learn
- How easily users could navigate to complete the task — checking Class 7A attendance.
- How they searched for a particular class's attendance.
- Whether they could read the data easily in a graphical format.
- The overall ease of navigating the app.
- Any frustrations or obstacles that got in the way of finishing the task.
What we observed
| Observation | What it told us |
|---|---|
| Task completed easily | Users had very little trouble finishing the task — the core flow held up. |
| Some text hard to read | A few labels and values needed better size and contrast. |
| Minor colour-palette concerns | Small adjustments needed to the palette for clarity and comfort. |
10What I took from it
- Design a role, not just a screen. With no precedent for the principal, the research and persona work decided the product — the UI followed from it.
- One real task anchors everything. "Check Class 7A attendance" kept the storyboard, task flow, wireframes and test all pointed at the same outcome.
- Readability is a feature. The test's clearest signal was legibility — text size, contrast and palette — which is exactly where the next iteration went.